PERFORMANCE
Our performancereturn ytd
28.48%*
1 YEAR RETURN
46.40%*
5 YEAR RETURN
-2.66%*
RETURN SINCE INCEPTION
10.84%**
*Year to date (YTD), 1 year, and 5 year returns are Time Weighted Rates of Return as of March 31, 2024, net of fees and expenses.
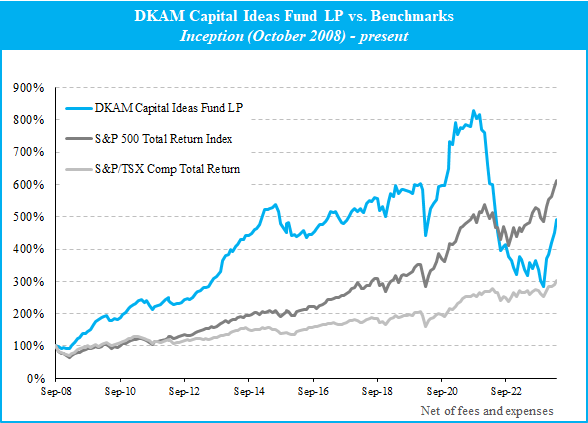
**Return since inception is Time Weighted Rate of Return since October 1, 2008, net of fees and expenses.

Historical Performance
Performance Since Inception – Oct 1, 2008
| JAN | FEB | MAR | APR | MAY | JUN | JULY | AUG | SEP | OCT | NOV | DEC | *YTD% | |
|---|---|---|---|---|---|---|---|---|---|---|---|---|---|
| 2008 | -0.90 | -5.71 | 0.46 | -6.13 | |||||||||
| 2009 | -0.12 | -2.01 | 9.48 | 10.68 | 9.98 | 3.09 | 9.41 | 1.21 | 3.41 | 3.62 | 12.01 | 5.36 | 88.17 |
| 2010 | 3.20 | 2.94 | 2.23 | 2.04 | -8.04 | -1.00 | 3.04 | -0.94 | 3.19 | 4.54 | 4.30 | 6.11 | 22.94 |
| 2011 | 2.25 | 2.23 | 2.23 | 3.84 | 0.70 | -3.32 | 2.60 | -6.03 | -5.56 | 3.62 | 1.54 | 1.76 | 5.31 |
| 2012 | 6.22 | 2.34 | -3.51 | -1.73 | -2.98 | 1.30 | 0.15 | 1.69 | 3.42 | 1.40 | -1.59 | 2.56 | 9.22 |
| 2013 | 5.06 | 2.07 | 1.06 | 3.98 | -0.33 | 1.19 | 5.60 | 3.42 | 1.36 | 5.54 | 10.39 | 3.48 | 51.68 |
| 2014 | 1.25 | 3.87 | -1.36 | 3.71 | 1.73 | 3.54 | -0.20 | 2.93 | 0.56 | 1.28 | 2.26 | 1.21 | 22.68 |
| 2015 | 2.36 | 6.23 | 3.46 | 0.17 | 0.47 | 0.26 | 1.91 | -4.17 | -7.03 | -5.73 | 5.83 | 1.22 | 4.06 |
| 2016 | -8.77 | 0.68 | -1.29 | 1.49 | 2.56 | -4.16 | 1.95 | -0.47 | 2.50 | 2.02 | 2.72 | -0.24 | -1.66 |
| 2017 | 2.36 | 1.71 | 4.16 | -0.19 | 0.18 | -3.62 | -2.82 | -0.75 | 2.16 | 2.93 | 2.31 | 2.24 | 10.85 |
| 2018 | -1.83 | 1.31 | -0.93 | -1.41 | 5.62 | 1.75 | -0.56 | 2.50 | -0.64 | -6.74 | 2.06 | -5.45 | -4.85 |
| 2019 | 9.27 | 4.58 | -1.58 | 5.85 | -4.00 | 1.90 | 0.00 | -0.73 | -0.37 | -1.15 | 4.75 | -0.11 | 19.24 |
| 2020 | 0.97 | -3.26 | -24.48 | 11.89 | 6.74 | 2.49 | 2.57 | 7.18 | 0.71 | -0.17 | 8.86 | 12.62 | 22.35 |
| 2021 | -1.00 | 9.29 | -4.68 | 2.84 | -0.54 | 1.78 | -0.83 | 6.34 | -2.99 | 1.69 | -5.71 | -1.30 | 3.93 |
| 2022 | -13.07 | -8.74 | -0.71 | -15.09 | -10.92 | -12.86 | 3.39 | 1.46 | -9.22 | -3.01 | -5.98 | -5.98 | -57.61 |
| 2023 | 16.55 | -1.83 | -8.71 | -5.52 | 12.34 | -4.75 | 6.71 | -7.48 | -9.67 | -6.01 | 29.50 | 3.83 | 19.01 |
| 2024 | 9.60 | 7.60 | 8.94 | 28.48 |
*Year to date (YTD) returns are Time Weighted Rates of Return as of March 31, 2024, net of fees and expenses.
